


Part 1 : Past Projects (Jan 2006 - April 2009) browse
Part 2 : Recent Projects
Introduction
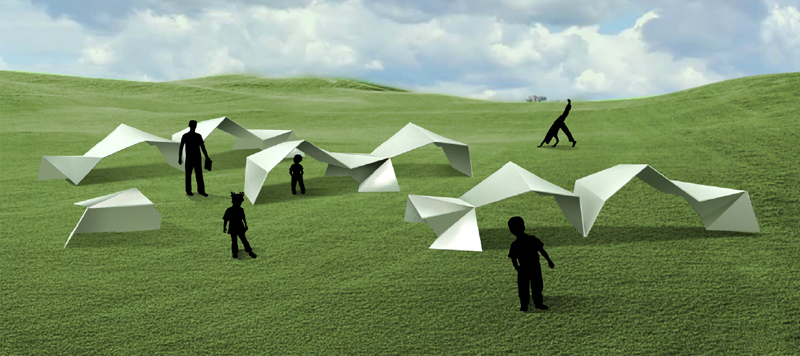
Sonoscape is an interactive installation that uses sounds and structures to create a playspace. This playspace proposal has been accepted by the City of Atlanta and will be installed at the end of April 2010 in the Freedom Park area of Atlanta.
Current status
The City of Atlanta has accepted our final version of the proposal, and we are now working on the fabrication of fiberglass elements, and also generating interactive sounds using arduino.
Physical Design
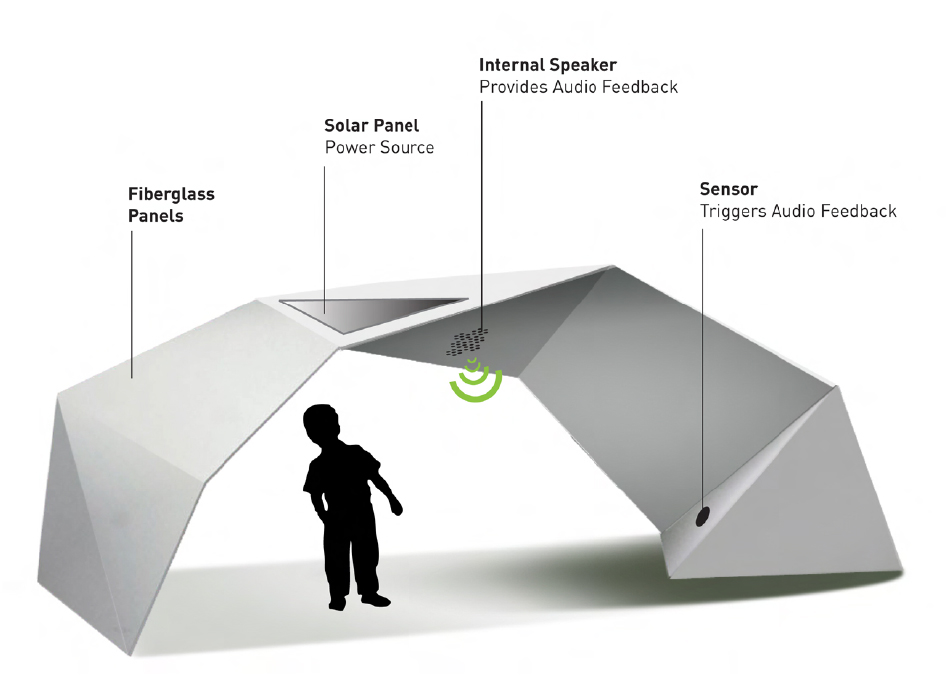
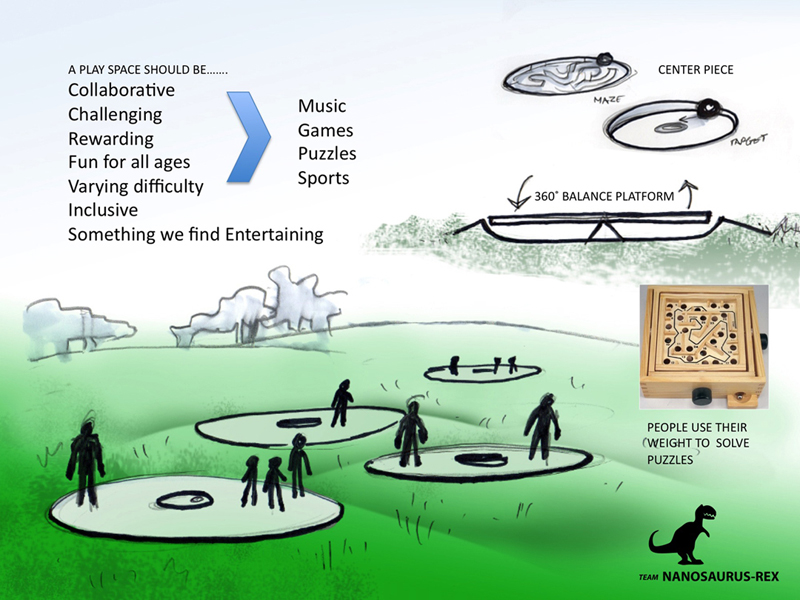
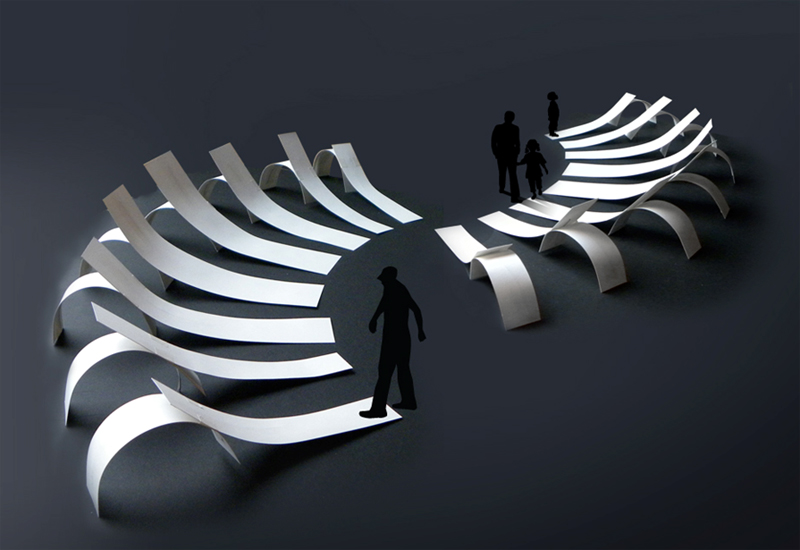
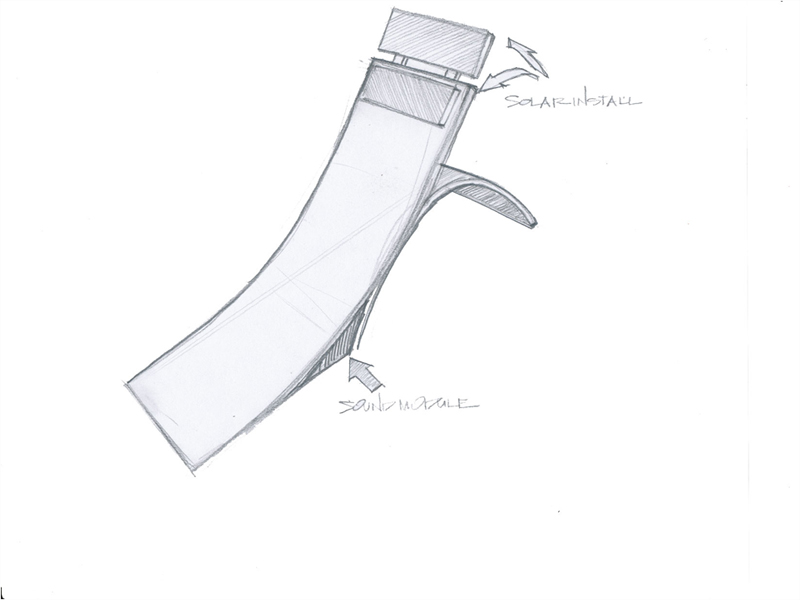
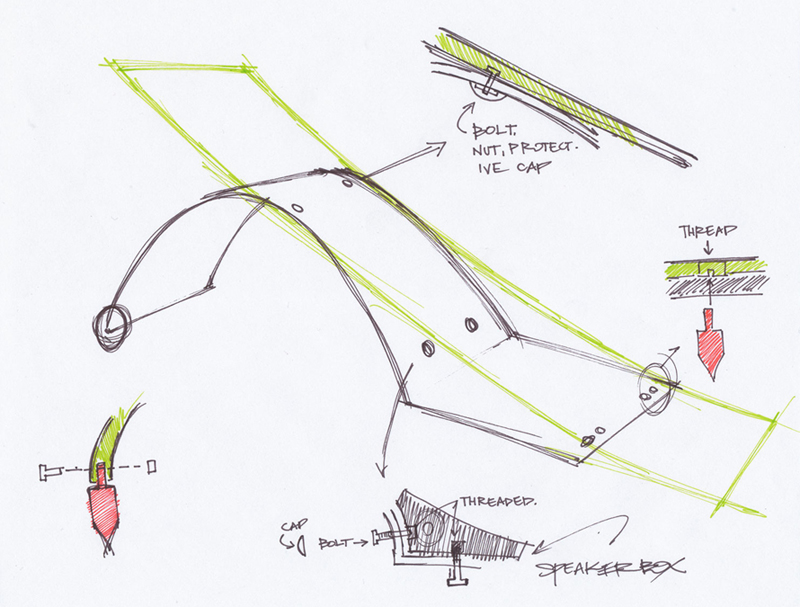
We did not want this to seem like an odd structure that just sprang out of nowhere. So, the physical design (shape and color) took inspiration from nature's sounds and shapes. To make each module safe for kids, they are made out of fiberglass with rounded edges. Each module's shape encourages play of different forms, as well as being a platform for relaxation.
Digital Design
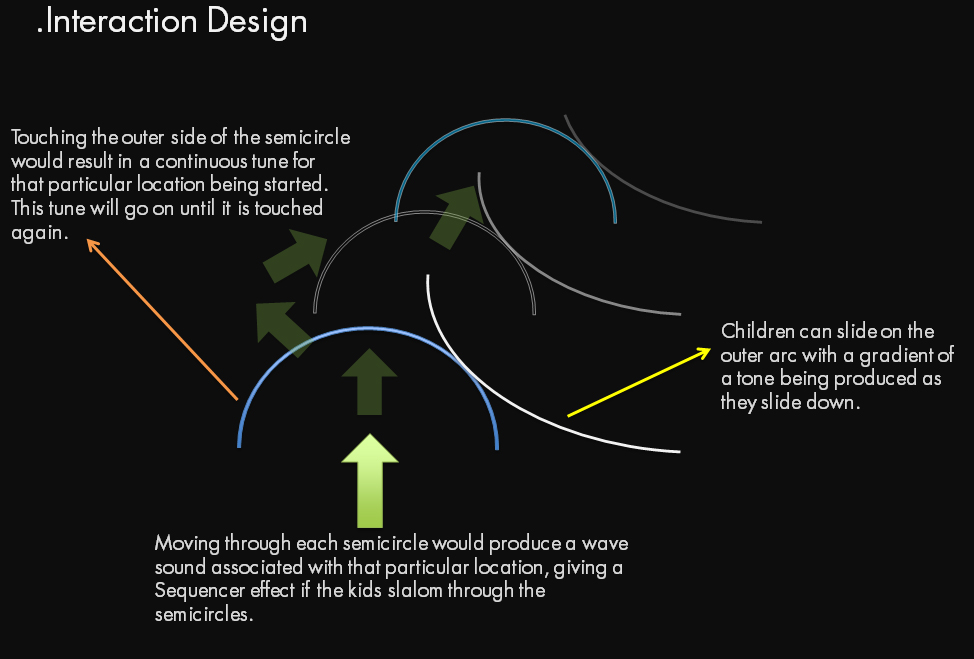
The digital aspect involves sound-based interaction and music generation. Depending on parameters like presence, distance, height and movement of people near each module, sounds of different instruments would be generated dynamically. Each module's hardware is powered by its own solar panel which drives the arduino, speakers and sensors.
Technical parts
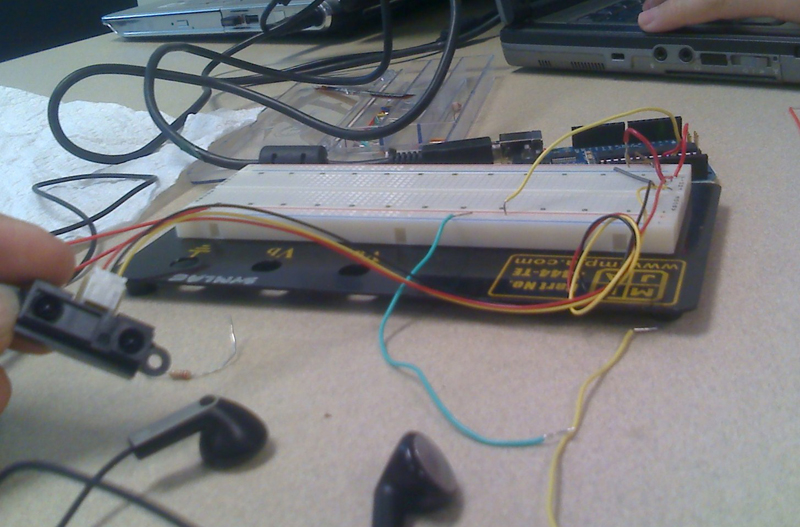
Each module has a set of around 16 sensors that are always on during the daytime. Using photo sensors, each module is turned off during night-time to save energy since the installation is powered by solar energy. Depending on the signals received from sensors (IR-range finders, photo-sensors and FSRs), the data is crunched by the arduino to create music.
We're using the wave shield on the arduino board to generate music on-the-fly, and the output signal is sent to speakers that are concealed within the fiber-glass. The sounds are generated such that the whole installation acts as a sort of synthesizer, encouraging play by people of different ages, and not just children.
My Role
The many different modules of this installation has been divided into 16 modules in total. I am working on the digital interaction aspect of two of these modules. This work includes sound generation using data obtained from sensors, and also hardware configuration using solar panels and the arduino.
Collaborators
This project is a joint effort between the Digital Media and Industrial Design departments at Georgia Tech as a part of the 2010 edition of the Experimental Media class being co-taught by Dr. Ali Mazalek and Dr. Claudia Winegarden.
Team Members : Jerry Fu (Computational Media), Ryan Hanser (Industrial Design), Zaki Ullah (Industrial Design), Gabriel Arronte (Computational Media) and myself (HCI-Digital Media)
Problem
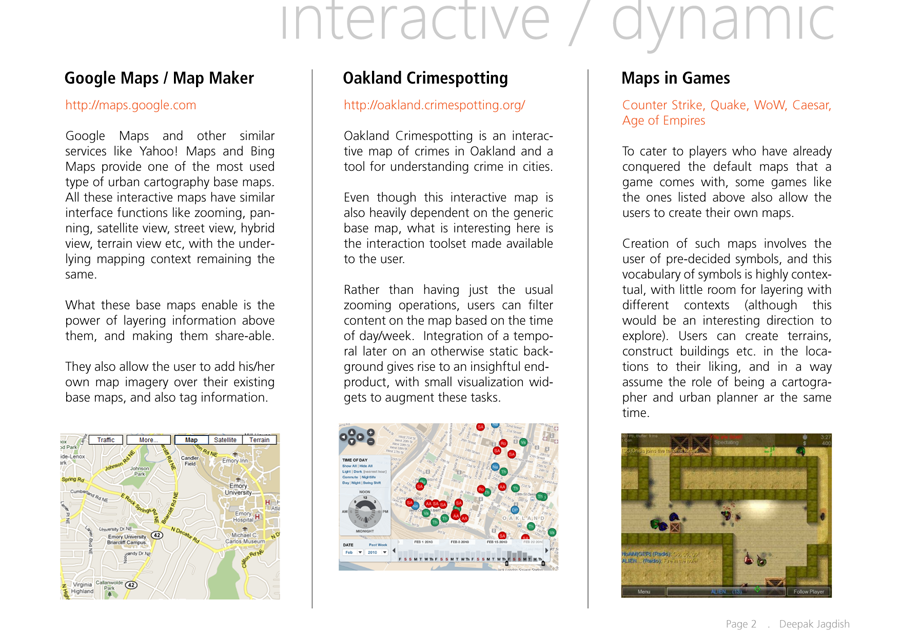
This project is my Masters Thesis, and it is an attempt to set right the glaring gaps in today's mapping solutions. As a user, when we try to use an interactive map online, we are bombarded with tons of unwanted imagery and labels which do little to serve the purpose of giving us only that chunk of information which is necessary.
Solution
b-Maps aims to provide the user with only the information that is required, abstracting away the unnecessary data. Most of the junk data is courtesy of the information-dense base maps. So, b-Maps starts with redesigning the basemap itself, and handling layers above one-by-one in a bottom-up approach.
Related Work
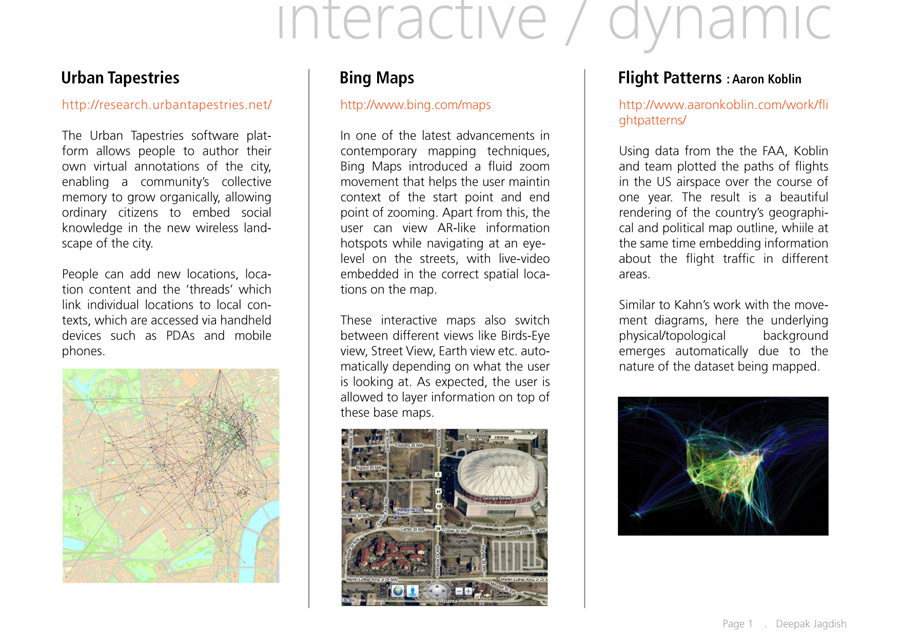
Inspiration for this project came from a paper titled 'Redefining the basemap' by Alison Sant in which she outlines the need for us to start thinking away from the contemporary basemaps that are used in many mapping solutions available now. Almost all of them have the same flat single-perspective terrain/street imagery, which in all probability is not the best base layer for some tasks.
Background Research
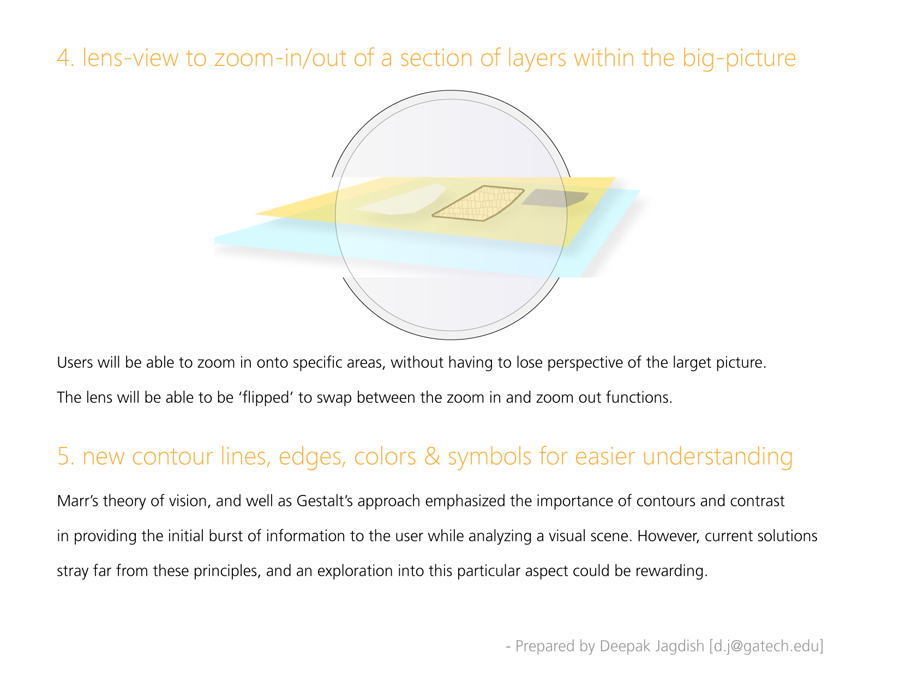
Cognitive understanding of maps: Marr's theory of vision as well as Gestalt's approach have indicated that for any given image, we process the edges and lines first using contrasts in the image. But we have strayed far from those principles, with current interactive maps being a boiling pot for innumerable colors and labels, all trying to answer too many questions at the same time.
Design
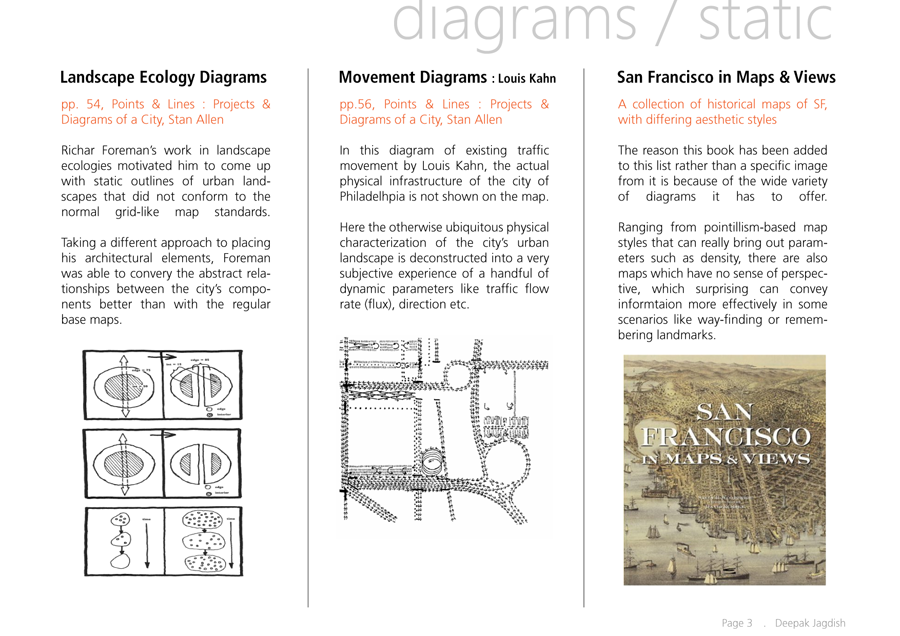
The proposal I submitted included around 5 different ways of redesigning basemaps using the data available from existing maps (proposals are shown in the image gallery). For this project, I have decided to focus on the first idea, which is, helping people figure out directions to a particular location.
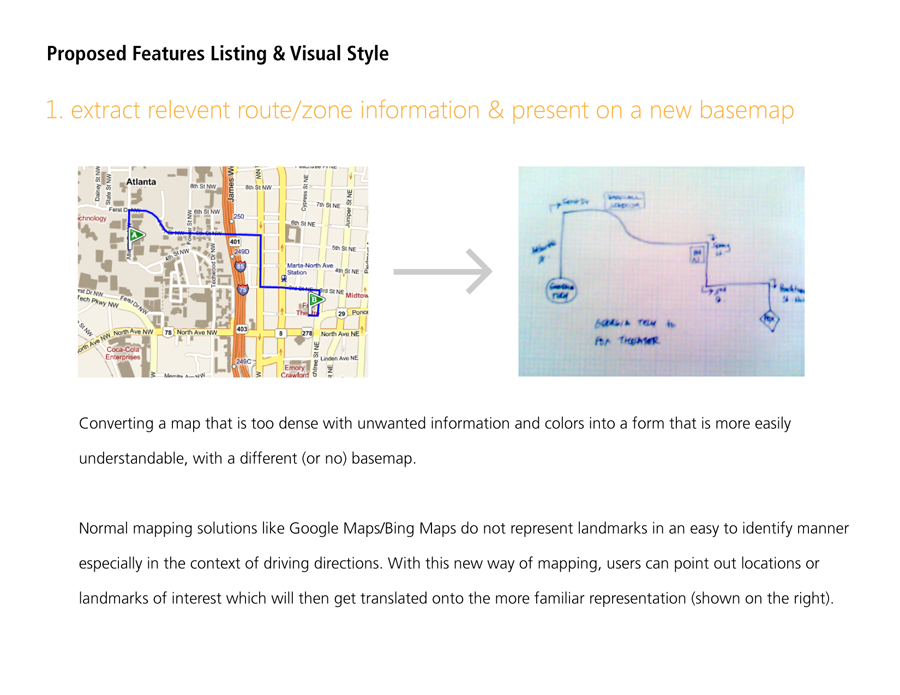
For this task, current mapping solutions like Google Maps and Bing Maps do a decent job at calculating time, route, etc. However, they fail to finally communicate the information to the user in a way that is focused for this particular task. In this project, my attempt is to translate the directions-data into a from that is more easily consumable by using hand-drawn symbolic representations.
Collaborators
This project is my thesis work towards my Master's degree in Human-Computer Interaction at Georgia Tech.
My advisor for this project is Dr. Carl DiSalvo, an assistant professor in the Digital Media department who also heads the City as a Learning Lab studio initiative.
Context
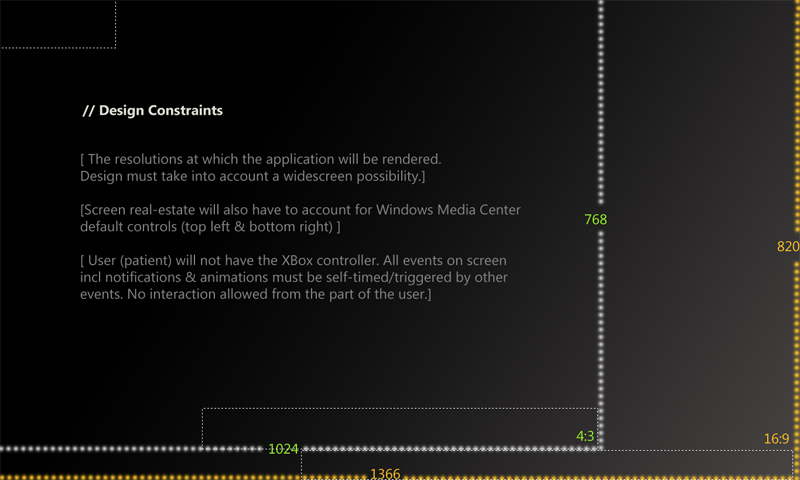
Project done at Microsoft Research's Medical Media Lab during my summer internship in 2009. A fully functional prototype was deployed in a leading hospital by the end of my internship. Initial requirements stated that patients were to be given a solution which would keep them updated about all the processes related to them (like tests, forms, bills etc.) in the hospital while being an in-patient.
Hacking the XBox
The technology available to solve this problem included XBox consoles and Microsoft's giant hospital database called Amalga. Since the XBox was not built for such kind of applications, we had to hack around the internal software to get many things working, including the UI and networking aspects. The app was also to be designed in such a way that patients could use it without the XBox controller.
Interaction
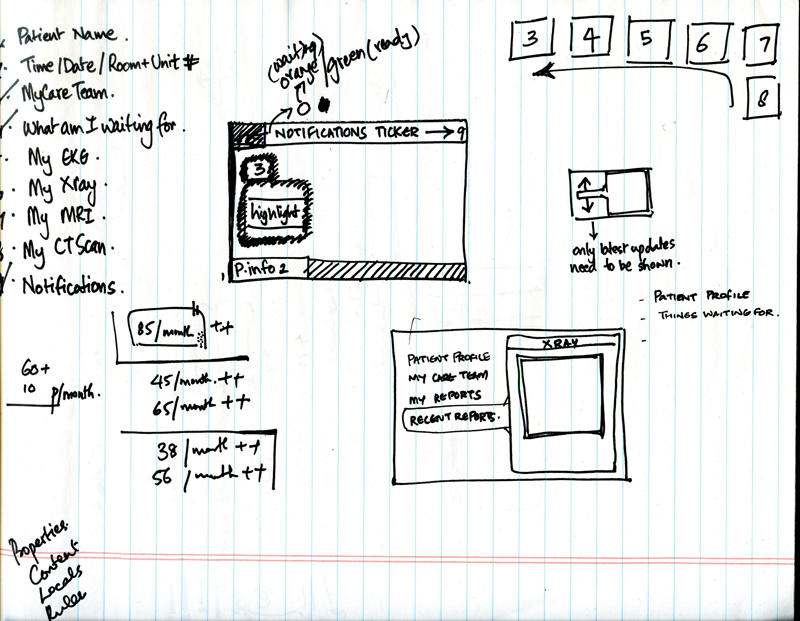
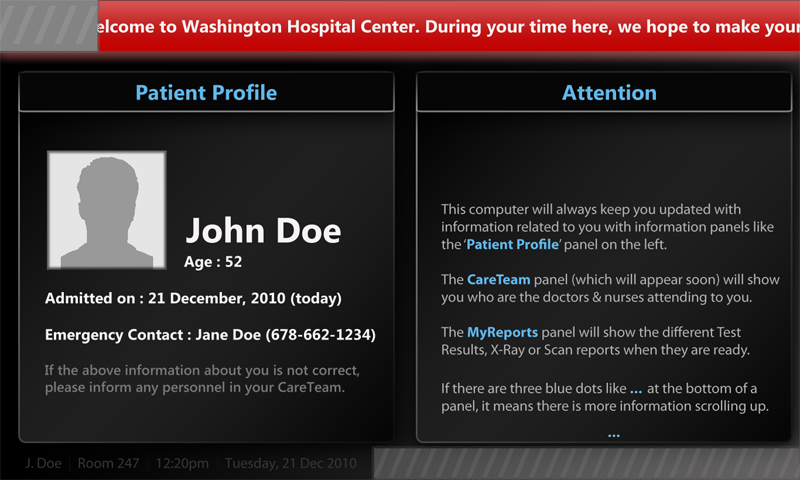
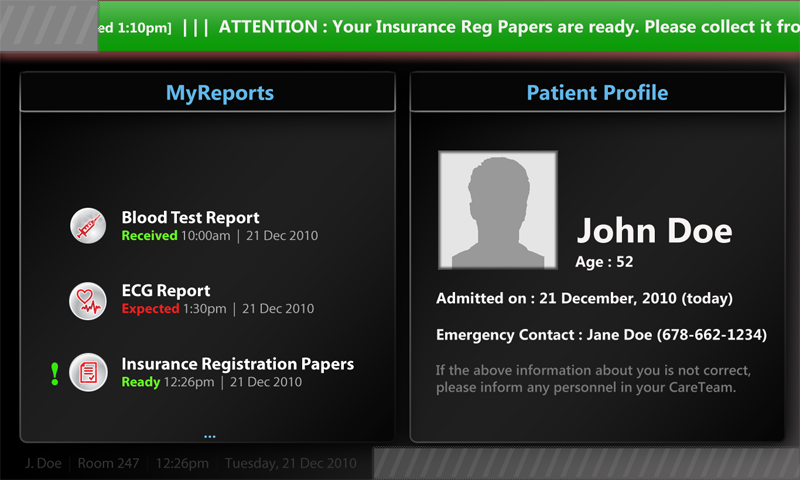
The interface was designed in a modular fashion so that required info could be sent to the patient's screen whenever necessary. To reduce the learning curve, it was modeled like a regular TV channel, including a news ticker that provided updates to the patient about workflows related to him/her. The interface can run on auto-mode, or informational panels could be navigated using the XBox controller.
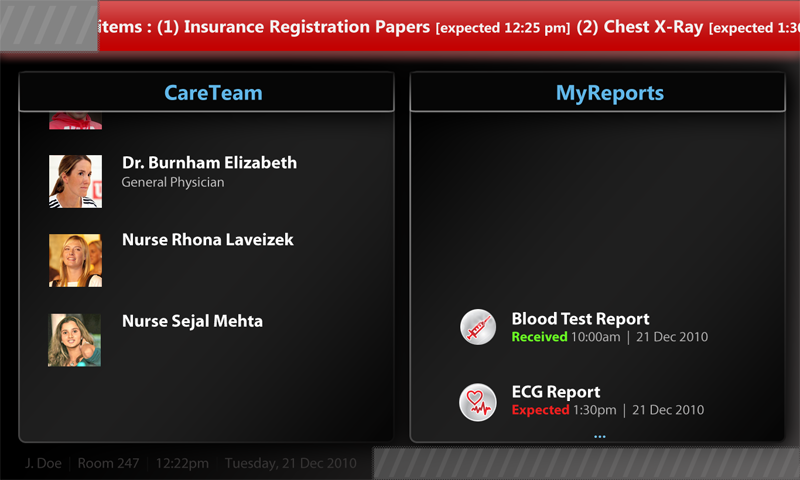
The interface included categories like My CareTeam which was a highly requested feature so that the patients knew the doctors and nurses who were taking care of them, Blood Test Reports and Scan Reports with high-low value indicators and so on. The design took into account colors, contrast and typeface requirements for patients with limited vision. UI was implemented using MCML (Media Center Markup Language).
My Role
My roles in the project spanned across UX-Research and UI Layer design+development. Tasks included conducting interviews with hospital staff, gathering requirements for application design and installation. Design+Development of the UI included working with MCML and C# to code and bind events with the backend database, and using Illustrator to create graphical assets.
Collaborators
This project was done along with Faisal Ahmed, a Ph.D student from Stony Brook University, who handled the backend programming, data-set management and networking aspects of this project.
We continually got feedback over different iterations from our M3L team (Microsoft Medical Media Lab), headed by Dr. Michael Gillam and our manager Prabhdeep Singh.
Introduction
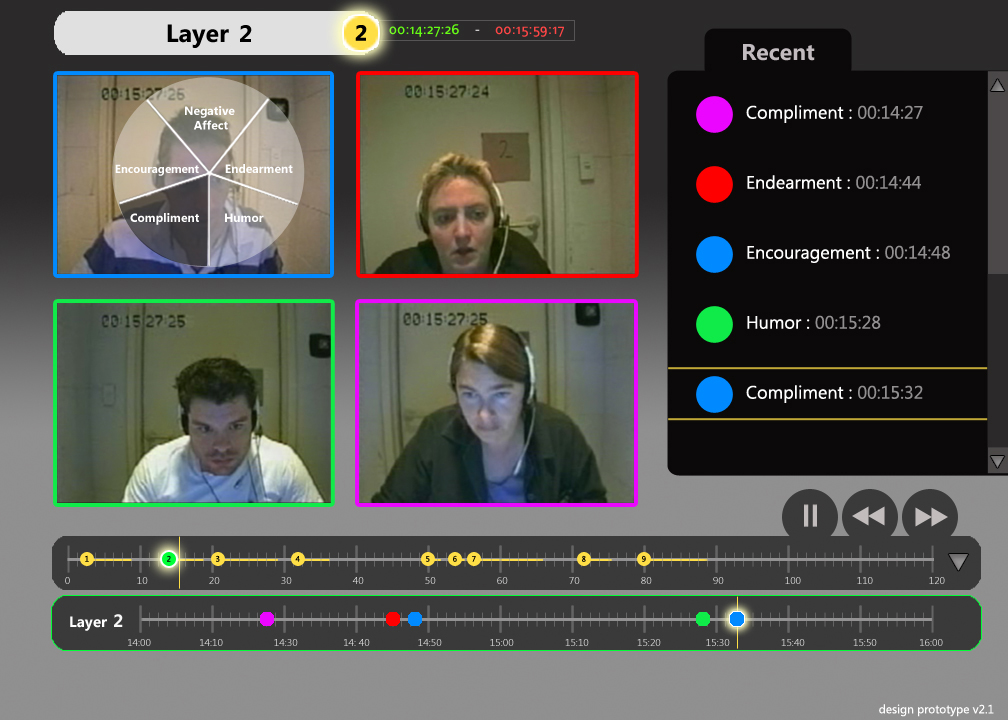
ecovrd [event coding and visual representation of data] is a tablet-based tool that allows users to code events (bevahiors, interactions, activities etc.) in real-time, and provide visualizations of the data. 'Coding' involves categorizing events based on who/what is being observed. Accepted for presentation at CHI 2010.
Context
This project is funded by NASA and was borne out of their need to be able to analyze team-interactions of astronauts during post-mission analysis. However, our design of the tool aims to make it versatile enough to be used in different research domains and scenarios, like any individual / entity / team activity.
Interaction
One of the primary goals while designing this system was to enable the user to code from video recordings OR live events happening off the screen. To make this happen, we made the coding procedure based on a simple pointing action on screen so that the user need not pause while entering codes.
The design also provides the user with the option of custom-defining coding categories, so that the same tool can be used by personnel in different domains. For instance, we've already had interest from improv theater groups who wish to analyze their acting performances, and also psychology researchers who want to study their video recordings of experiments in detail. Once the coding data is collected, the user can visualize this data using viz-widgets.
Innovations
The following features in this tool are patented:
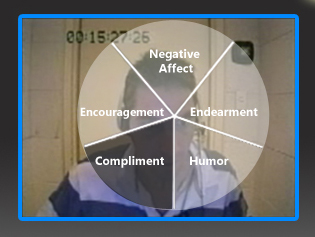
- Coding as a Pointing Action : Each agent is 'assigned' an individual space on the screen, on which the coding categories are overlaid in the form of a pie-menu or a grid, thus enabling easy selection in near-real-time.
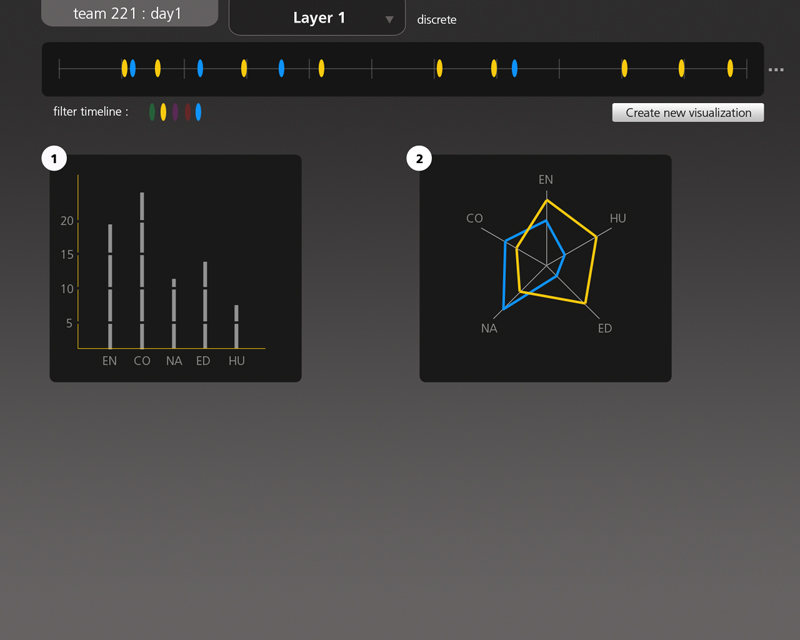
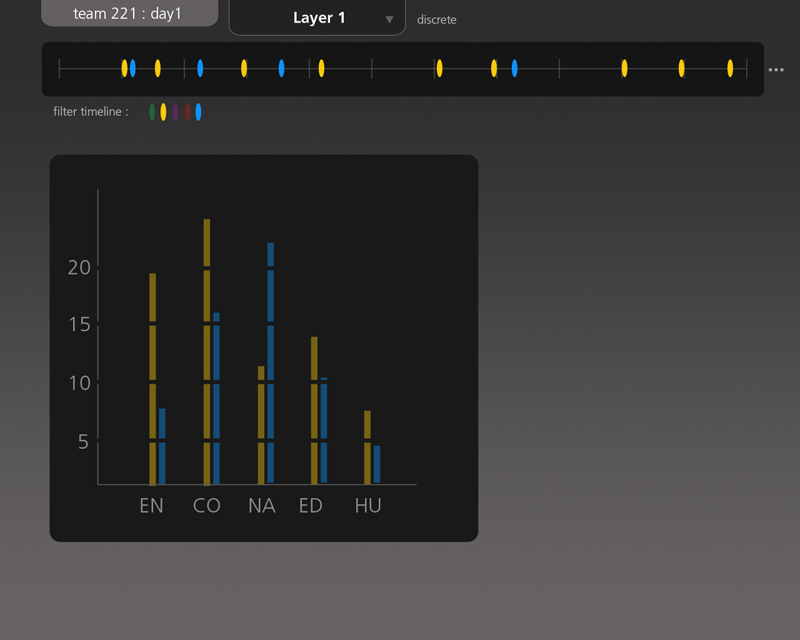
- Intuitive Workspace Elements : An interactive timeline with different layers catering to different kinds of data that the user wishes to capture. Each code selected is immediately reflected on the timeline, and also the Coding History Panel.
- Visualization Widgets : Using the coding data generated, the user is provided with quick customizable visualization widgets that can be combined and filtered to quickly 'eye-ball' the data-set before it is later analysed in depth using other viz tools.
Team
- The principal investigator for this project is Dr. Ute Fischer, research scientist at Georgia Tech. She specializes in Behavioral Psychology in team-based interactions, and previously worked as a research scientist at NASA.
- I am the interaction designer and the UI layer designer+developer for this project. This has been my research assistantship project for the last 2 years during my time at Georgia Tech.
- The lead developer for this project is Abbas Attarwala, graduate student in Computer Science at Georgia Tech, who joined our team a year ago.